GitOps with Flux
GitOps is getting a lot of attention in the cloud-native community, and in the previous article in this series, we explored the features of ArgoCD. In …

GitOps with ArgoCD
Following on from our introductory article on the subject of GitOps, the aim of this next article is to delve into the first of the GitOps tools we’re …
What is GitOps?
It seems that the term ‘GitOps’ has gradually crept into the consciousness and vernacular of anyone associated with the cloud-native approach to softw …

Getting out of technical debt
Kubernetes is a fast-moving open-source project. The guiding principle being: release early and release often. This philosophy is a key reason Kuberne …
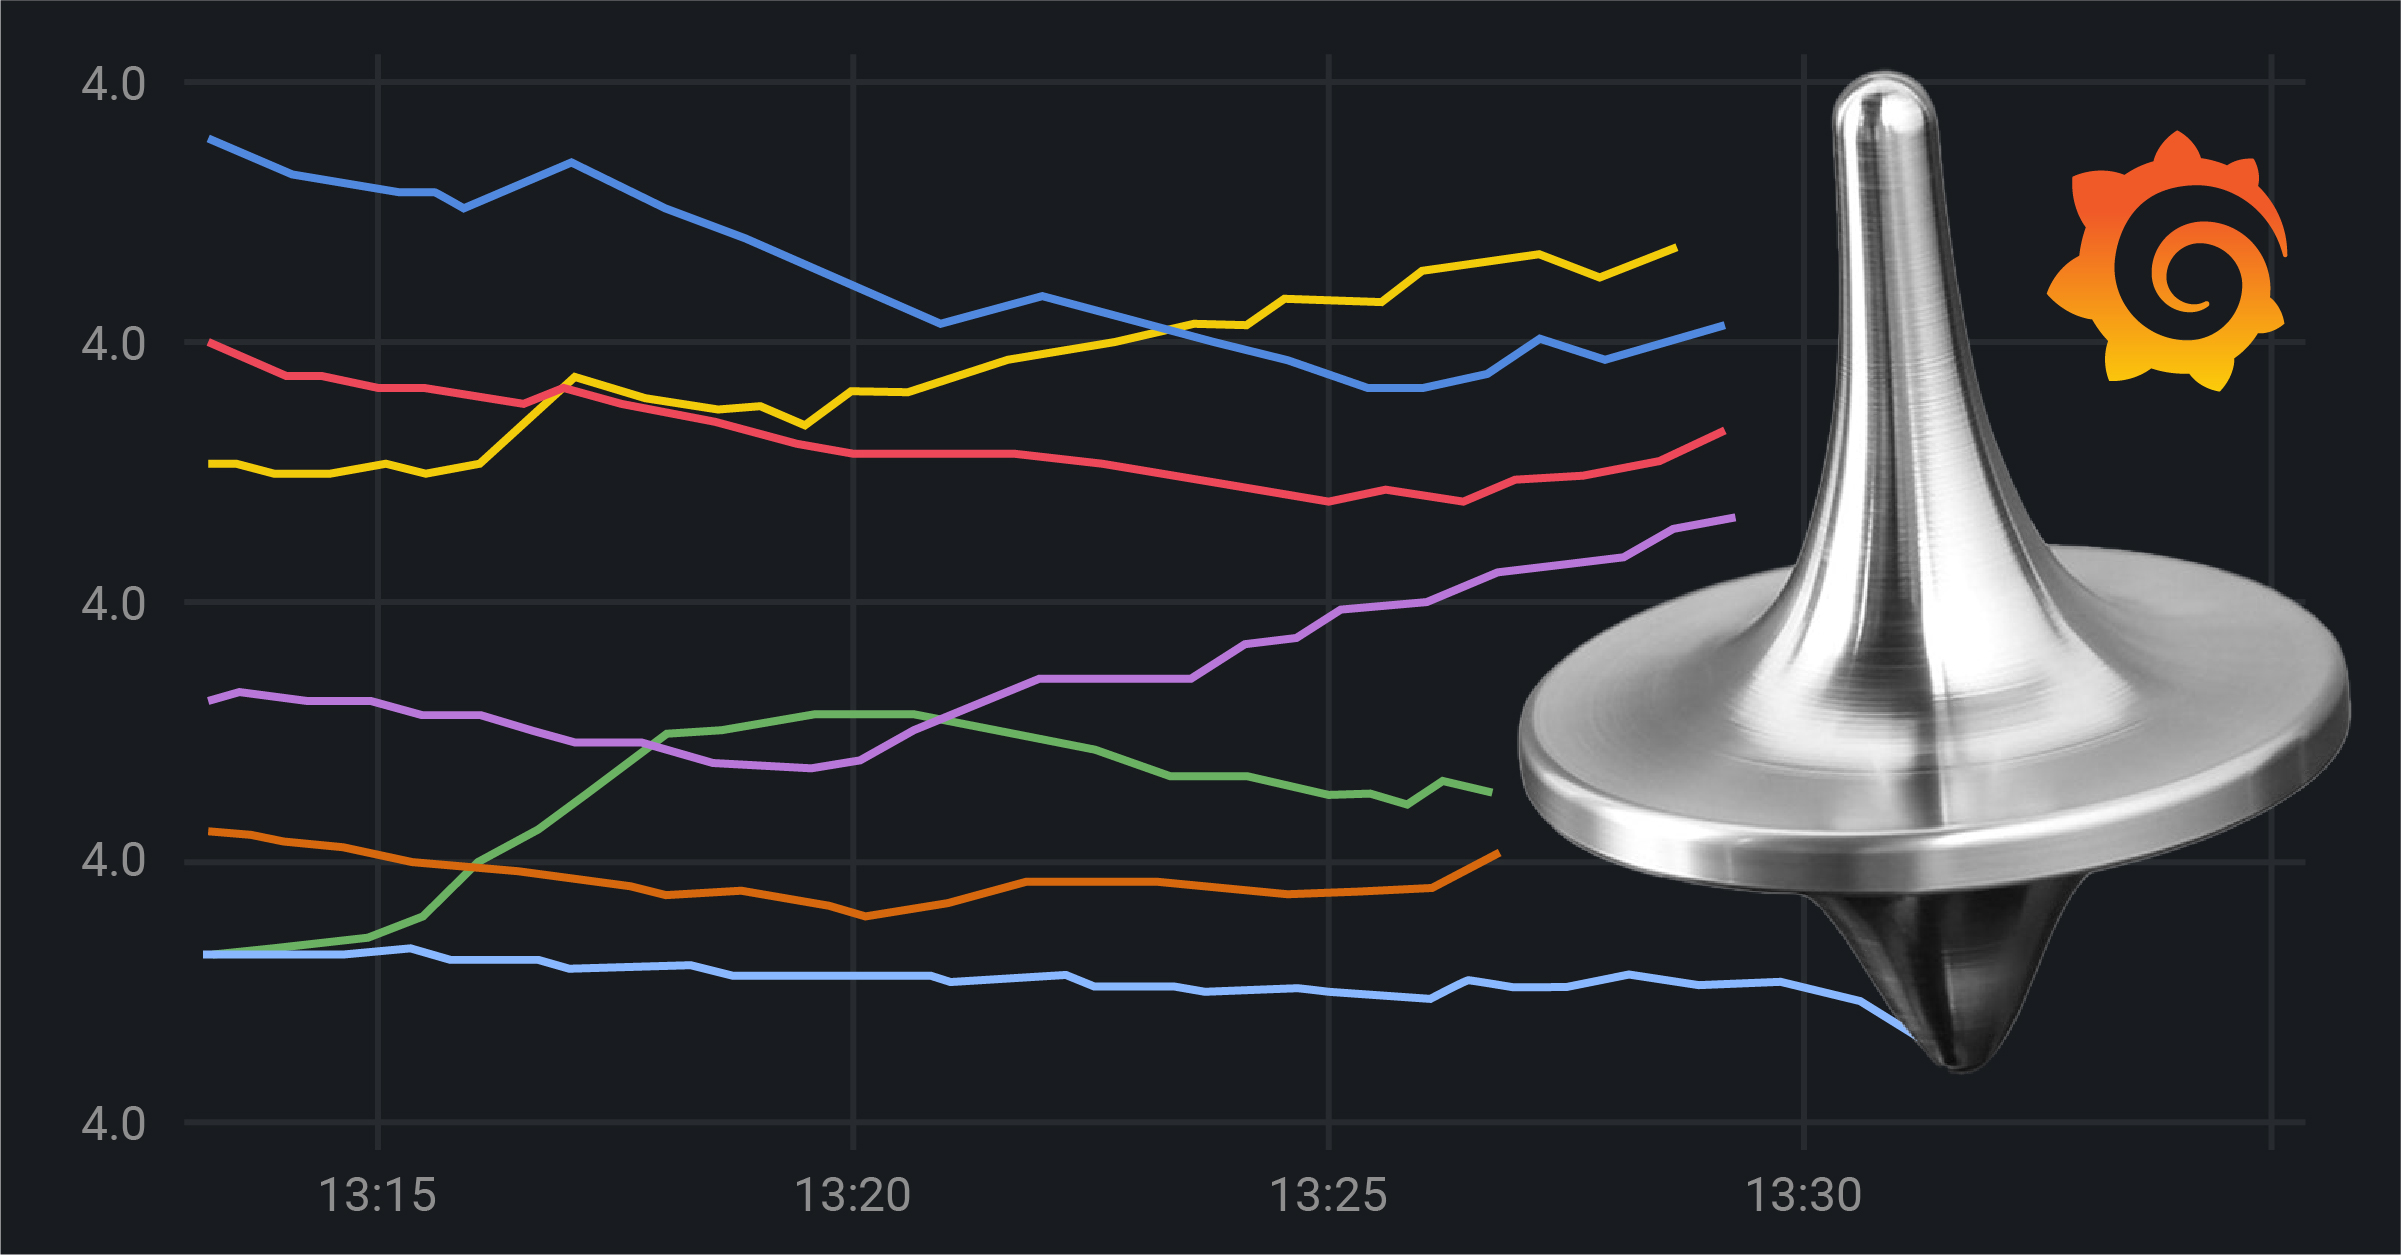
Grafana-ception, or how we do Grafana analytics
1. Finding the right solution At Giant Swarm, we use Prometheus to monitor our infrastructure, but this is better explained in this blog post and in i …

New: managed Linkerd service mesh
Why observability?

Scaling on-demand Prometheus servers with sharding
It’s been a few years since we last wrote about our Prometheus setup. I’d recommend reading that article for context first, but for those looking for …

New: built-in Grafana dashboards now available to all Giant Swarm users
If you’re reading this, you probably already know how important observability is for cloud-native, especially at an infrastructure level. As part of o …
Developing for Kubernetes with Okteto
In this last article in this series on developing cloud-native apps for Kubernetes, we're taking a look at another popular developer solution, Okteto. …


