Introducing the Observability Platform
Giant Swarm is all about making your platform engineering smarter. We deliver world-class runtime capability through our Kubernetes Cluster Fleet Mana …

Grafana-ception, or how we do Grafana analytics
1. Finding the right solution At Giant Swarm, we use Prometheus to monitor our infrastructure, but this is better explained in this blog post and in i …

Scaling on-demand Prometheus servers with sharding
It’s been a few years since we last wrote about our Prometheus setup. I’d recommend reading that article for context first, but for those looking for …

New: built-in Grafana dashboards now available to all Giant Swarm users
If you’re reading this, you probably already know how important observability is for cloud-native, especially at an infrastructure level. As part of o …

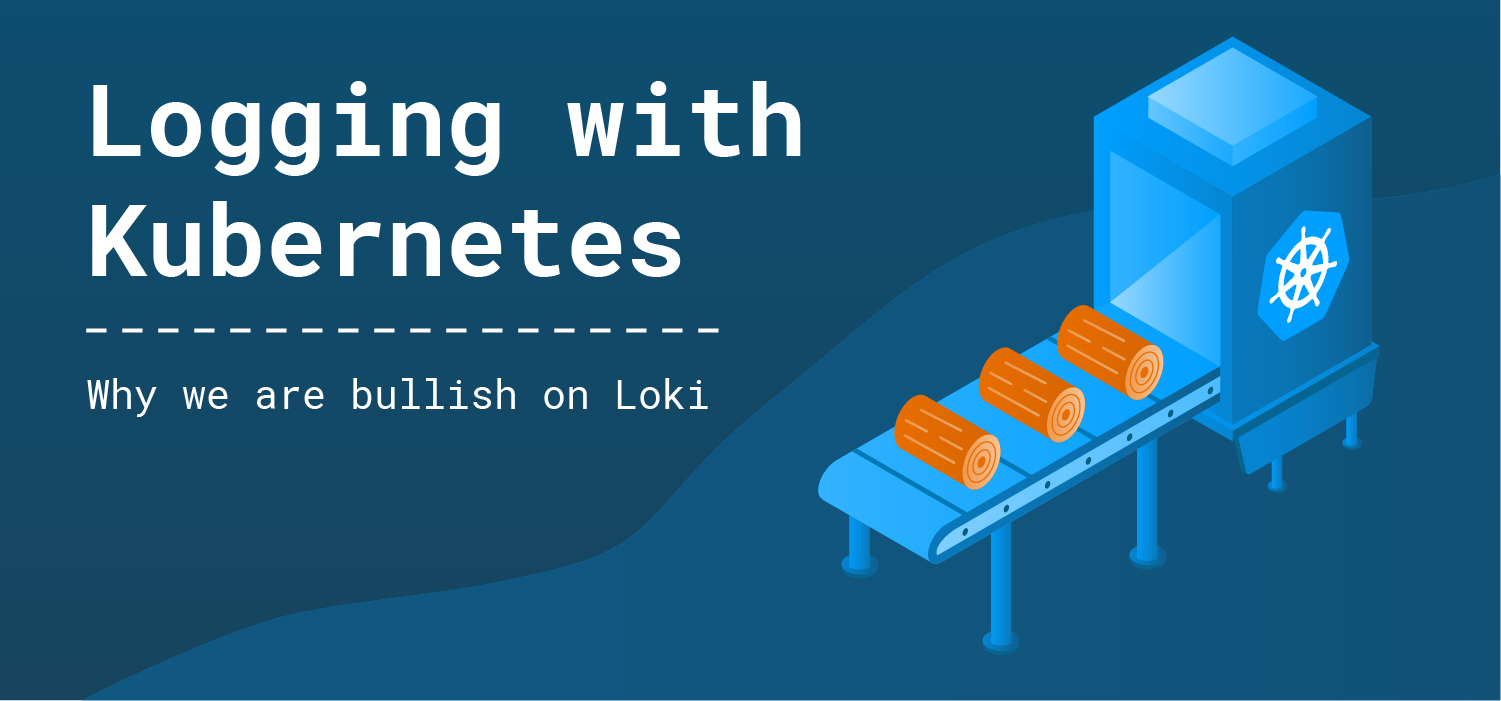
Logging in Kubernetes: why we are bullish on Loki
TL;DR: We are bullish on Loki — and we have six reasons why we (and maybe you) should be. Our Kubernetes Platform Architect and epic series writer for …

Part 6: Prometheus — The Hidden Hero
Intro Let’s take a look back before we move forward. In our story so far, we’ve built our demo app (Part 1 and Part 2). Next up, in Part 3, we learned …

Part 5: Traces of Your Microservices
Introduction Welcome to the fifth part of our blog series that focuses on how to develop, deploy, and debug microservices running in the cloud-native …

Monitoring On-Demand Kubernetes Clusters with Prometheus
Monitoring our infrastructure is of paramount importance at Giant Swarm, as our customers rely on us to provide fully-operated clusters that power som …


