Istio monitoring explained
by Fernando Ripoll on Mar 28, 2019

Nobody would be surprised if I say “Service Mesh” is a trending topic in the tech community these days. One of the most active projects in this area is Istio. It was jointly created by IBM, Google, and Lyft as a response to known problems with microservice architectures. Containers and Kubernetes greatly help with adopting a microservices architecture. However, at the same time, they bring a new set of new problems we didn’t have before.
Nowadays, all our services use HTTP/gRPC APIs to communicate between themselves. In the old monolithic times, these were just function calls flowing through a single application. This means, in a microservice system, that there are a large number of interactions between services which makes observability, security, and monitoring harder.
There are already a lot of resources that explain what Istio looks like and how it works. I don’t want to repeat those here, so I am going to focus on one area - monitoring. The official documentation covers this but understanding it took me some time. So in this tutorial, I will guide you through it. So you can gain a deeper understanding of using Istio for monitoring tasks.
State of the art
One of the main characteristics of why a service mesh is chosen is to improve the observability. Up to now, developers had to instrument their applications to expose a series of metrics, often using a common library or a vendor’s agent like New Relic or Datadog. Afterwards, operators were able to scrape the application’s metric endpoints using a monitoring solution getting a picture of how the system was behaving. But having to modify the code is a pain, especially when there are many changes or additions. And scaling this approach to multiple teams can make it hard to maintain.
The Istio approach is to expose and track application behaviour without touching a single line of code. This is achieved thanks to the ‘sidecar’ concept, which is a container that runs alongside our applications and supplies data to a central telemetry component. The sidecars can sniff a lot of information about the requests, thanks to being able to recognise the protocol being used (redis, mongo, http, grpc, etc.).
Mixer, the Swiss Army Knife
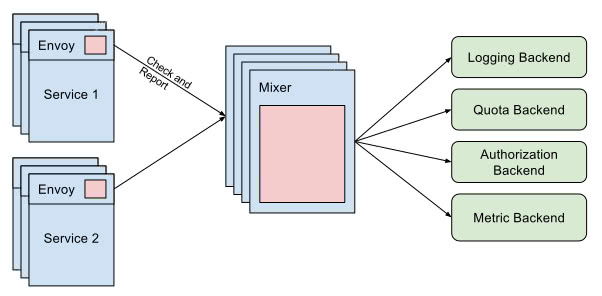
Let’s start by explaining the Mixer component. What it does and what benefits does it bring to monitoring. In my opinion, the best way to define ‘Mixer’ is by visualizing it as an attribute processor. Every proxy in the mesh sends a different set of attributes, like request data or environment information, and ‘Mixer’ processes all this data and routes it to the right adapters.
An ‘adapter’ is a handler which is attached to the ‘Mixer‘ and is in charge of adapting the attribute data for a backend. A backend could be whichever external service is interested in this data. For example, a monitoring tool (like Prometheus or Stackdriver), an authorization backend, or a logging stack.

Concepts
One of the hardest things when entering the Istio world is getting familiar with the new terminology. Just when you think you’ve understood the entire Kubernetes glossary, you realize Istio adds more than fifty new terms to the arena!
Focussing on monitoring, let’s describe the most interesting concepts that will help us benefit from the mixer design:
- Attribute: A piece of data that is processed by the mixer. Most of the time this comes from a sidecar but it can be produced by an adapter too. Attributes are used in the Instance to map the desired data to the backend.
- Adapter: Logic embedded in the mixer component which manages the forwarding of data to a specific backend.
- Handler: Configuration of an adapter. As an adapter can serve multiple use cases, the configuration is decoupled making it possible to run the same adapter with multiple settings.
- Instance: Is the entity which binds the data coming from Istio to the adapter model. Istio has a unified set of attributes collected by its sidecar containers. This data has to be translated into the backend language.
- Template: A common interface to define the instance templates. https://istio.io/docs/reference/config/policy-and-telemetry/templates/
Creating a new monitoring case
After defining all the concepts around Istio observability, the best way to embed it in our minds is with a real-world scenario.
For this exercise, I thought it would be great to get the benefits from Kubernetes labels metadata and thanks to it, track the versioning of our services. It is a common situation when you’re moving to a microservice architecture to end up having multiple versions of your services (A/B testing, API versioning, etc). The Istio sidecar sends all kinds of metadata from your cluster to the mixer. So in our example, we will leverage the deployment labels to identify the service version and observe the usage stats for each version.
For the sake of simplicity let’s take an existing project, the Google microservices demo project, and make some modifications to match our plan. This project simulates a microservice architecture composed of multiple components to build an e-commerce website.
First things first, let’s ensure the project runs correctly in our cluster with Istio. Let’s use the auto-injection feature to deploy all the components in a namespace and have the sidecar injected automatically by Istio.
$ kubectl label namespace mesh istio-injection=enabled
Warning: Ensure mesh namespace is created beforehand and your kubectl context point to it.
If you have a pod security policy enabled, you will need to configure some permissions for the init container in order to let it configure the iptables magic correctly. For testing purposes you can use:
$ kubectl create clusterrolebinding mesh --clusterrole cluster-admin --serviceaccount=mesh:default
This binds the default service account to the cluster admin role. Now we can deploy all the components using the all-in resources YAML document.
$ kubectl apply -f release/kubernetes-manifests.yaml
Now you should be able to see pods starting in the mesh namespace. Some of them will fail because the Istio resources are not yet added. For example, egress traffic will not be allowed and the currency component will fail. Apply these resources to fix the problem and expose the frontend component through the Istio ingress.
$ kubectl apply -f release/istio-manifests.yaml
Now, we can browse to see the frontend using the IP or domain supplied by your cloud provider (the frontend-external service is exposed via the cloud provider load balancer).
As we have now our microservices application running, let’s go a step further and configure one of the components to have multiple versions. As you can see in the microservices YAML, the deployment has a single label with the application name. If we want to manage canary deployments or run multiple versions of our app we could add another label with the versioning.
apiVersion: extensions/v1beta1
kind: Deployment
metadata:
  name: currencyservice
spec:
  template:
    metadata:
      labels:
        app: currencyservice
        version: v1
After applying the changes to our cluster, we can duplicate the deployment with a different name and changing the version.
apiVersion: extensions/v1beta1
kind: Deployment
metadata:
  name: currencyservice2
spec:
  template:
    metadata:
      labels:
        app: currencyservice
        version: v2
...
And now submit it to the API again.
$ kubectl apply -f release/kubernetes-manifests.yaml
Note: Although we apply again all the manifests, only the ones that have changed will be updated by the API.
An avid reader has noticed that we did a trick because the service selector only points to the app label. That way the traffic will be split between the versions equitably.
From the ground to the sky
Now let’s add the magic. We will need to create three resources to expose the version as a new metric in prometheus.
First, we’ll create the instance. Here we use the metric instance template to map the values provider by the sidecars to the adapter inputs. We are only interested in the workload name (source) and the version.
apiVersion: "config.istio.io/v1alpha2"
kind: metric
metadata:
  name: versioncount
  namespace: mesh
spec:
  value: "1"
  dimensions:
    source: source.workload.name | "unknown"
    version: destination.labels["version"] | "unknown"
  monitored_resource_type: '"UNSPECIFIED"'
Now let’s configure the adapter. In our case we want to connect the metric to a Prometheus backend. So we’ll define the metric name and the type of value the metric that will serve to the backend (Prometheus DSL) in the handler configuration. Also the label names it will use for the dimensions.
apiVersion: "config.istio.io/v1alpha2"
kind: prometheus
metadata:
  name: versionhandler
  namespace: mesh
spec:
  metrics:
  - name: version_count # Prometheus metric name
    instance_name: versioncount.metric.mesh # Mixer instance name (fully-qualified)
    kind: COUNTER
    label_names:
    - source
    - version
Finally, we’ll need to link this particular handler with a specific instance (metric).
apiVersion: "config.istio.io/v1alpha2"
kind: rule
metadata:
  name: versionprom
  namespace: mesh
spec:
  match: destination.service == "currencyservice
.mesh.svc.cluster.local"
  actions:
  - handler: versionhandler.prometheus
    instances:
    - versioncount.metric.mesh
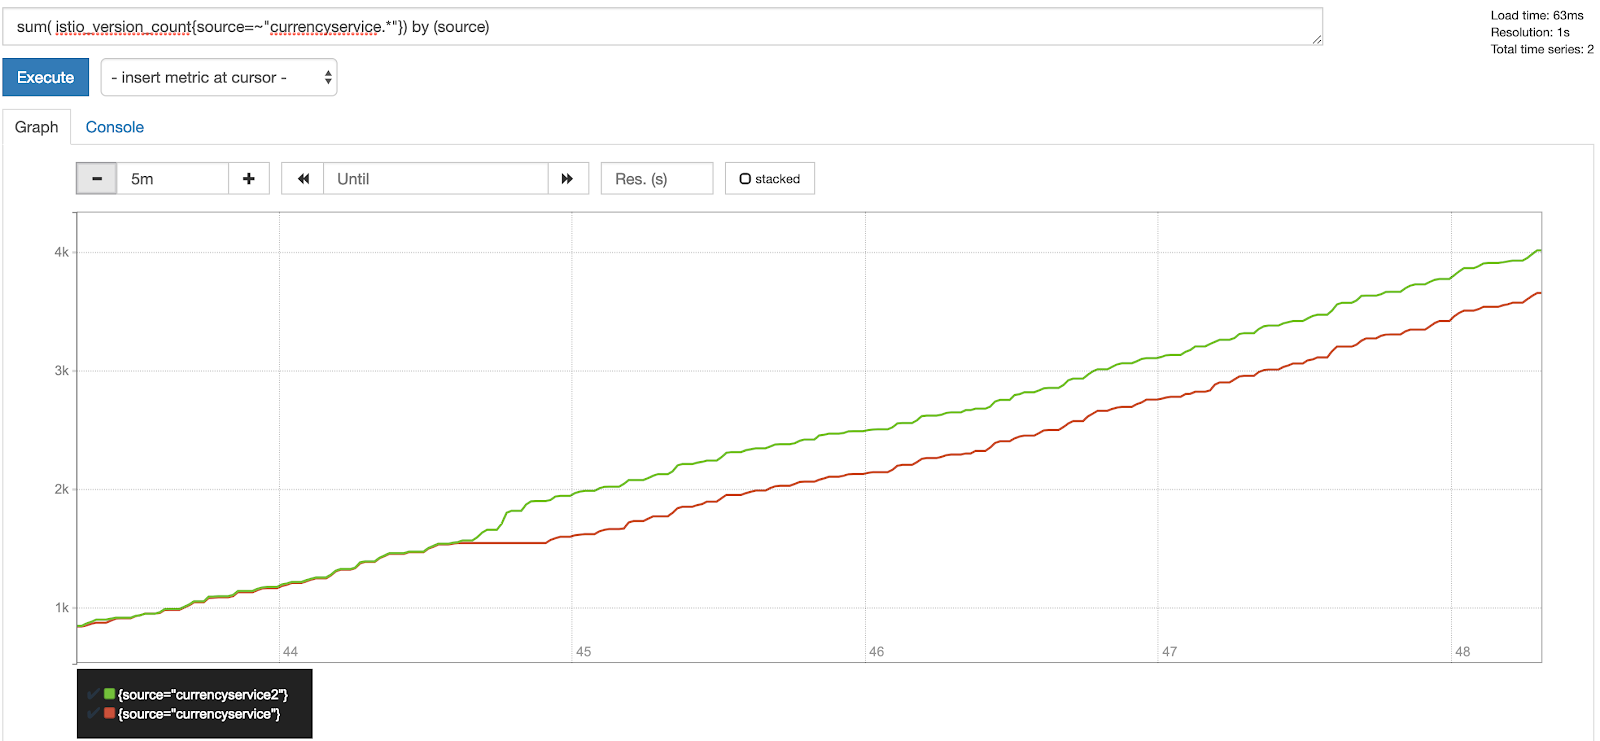
Once those definitions are applied, Istio will instruct the prometheus adapter to start collect and serve the new metric. If we take a look at the prometheus UI now searching for the new metric, we should be able to see something like:

Conclusion
Good observability in a microservice architecture is not easy. Istio can help to remove the complexity from developers and leave the work to the operator.
At the beginning it may be hard to deal with all the complexity added by a service mesh. But once you’ve tamed it, you’ll be able to standardize and automate your monitoring configuration and build a great observability system in record time.
Further information
-
Watch the on-demand webinar: Using Istio to Securely Monitor your Services.
-
How to install Istio in your cluster
You May Also Like
These Related Stories

Application Configuration Management with Kustomize
In this series of articles, we're taking an in-depth look at application configuration management in Kubernetes. In the previous article, we explored …

Grafana-ception, or how we do Grafana analytics
1. Finding the right solution At Giant Swarm, we use Prometheus to monitor our infrastructure, but this is better explained in this blog post and in i …

Grafana Logging using Loki
Loki is a Prometheus-inspired logging service for cloud native infrastructure.
